 TR
TR EN
EN DE
DE FR
FR AR
AR PL
PLShowing 1–16 of 19 results
Products
- AF_03
Avalanche Simulator
AF_03In the avalanche simulator, the visitor starts the snowfall in the simulation model by pressing the button on the table. An avalanche is formed by spraying the accumulated snow (ball). In one of the two separate models, there is a terrain without vegetation, and in the other there is a terrain with trees and barriers. The visitor observes the differences between the two models and examines the effects of deforestation on avalanche damage.
AF_03 - DM_19
Ball Launching Unit
DM_19Visitors lift the big ball about 1 m by pulling the string. When released, the air we move passes through pipes of different widths and compresses the air at the bottom, launching the tennis ball connected at the bottom into the air. The force that moves the small ball is the pressure of the air.
DM_19 - DM_01
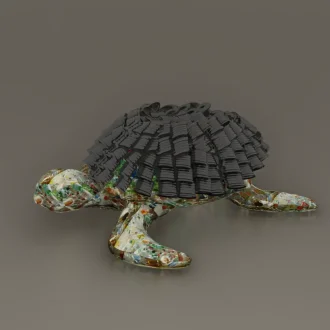
Caretta Caretta from waste
DM_01The beaches are one of the important breeding centers of Caretta Carettas. The loggerheads identified with the beaches have been transformed into an iconic sculpture with waste.
DM_01 - DM_06
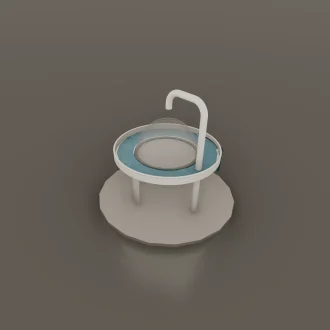
Fanus Photo Space
DM_06Visitors leave with a souvenir of their experience in the science park by taking fun poses while looking at their surroundings with water flowing over them under the protection of the glass lantern.
DM_06 - AF_07
Fault Lines
AF_07Visitors apply paper tape along fault lines at three stations representing different types of tectonic plate movement. At each station, they rotate a crank that forces the plates to move relative to each other, modeling plunging, spreading or shear forces in typical plate motions. The tape resists movements until the pressure is too high and, depending on the station, splits, tears/creases or breaks.
AF_07 - DM_20
Floating Stone
DM_20It is a device that keeps the stone in the air with water pressure. Visitors realize the power of water pressure with the floating stone device.
DM_20 - AF_17
Flood and Flood Simulator
AF_17Visitors can make it rain from the clouds in the models by pressing the button on the table. The model on the left shows houses built on a concrete floor and a stream bed. Here, it is noticeable that the houses have been badly damaged by the flood. On the right, in the forest in the model, some of the flood water is absorbed by the soil, reducing the impact of the flood. It is learned that the destruction of forests affects the consequences of flooding.
AF_17 - AF_12
Global Warming Potential
AF_12There are 4 circles for each greenhouse gas on the table. The temperature felt in the circles varies according to the rate of impact of the respective greenhouse gas on global warming. The order from the hottest circle to the least hot is as follows: phosphorus gases, nitrous oxide, methane and carbon dioxide. On and around the map of the world on the table, the proportion of greenhouse gases in the atmosphere is shown with LEDs.
AF_12 - AF_09
Hose
AF_09The polar vortex, which normally blows in a circular formation, is unevenly distributed due to climate change. Visitors observe the formation of a tornado on the apparatus. They get information about the effects of the relationship between the polar vortex and climate change on seasonal conditions.
AF_09 - DM_09
Kinetic Wind Power
DM_09It is an axis-centered kinetic weathervane assembly, whose momentum is driven by the wind. Visitors notice the action that occurs when the kinetic sculptures move with the force of the wind.
DM_09 - AF_05
Layers of the World
AF_05There is a quarter circle on the table. By sliding the slider on the table, the layers inside the sphere move and open to the right. The innermost sphere is led to represent the temperature of the core.
AF_05 - DM_15
Orchestra
DM_15Visitors will hear the rhythms of different instruments through the buttons. They will be able to make their own music by pressing multiple buttons at the same time.
DM_15 - AF_15
Ozone Layer
AF_15It is an interactive device in which the change in the ozone layer over Antarctica over the years is reflected on the half-world globe on the table. The year slider starts from 1979 and continues until the year with the most recent data.
AF_15 - DM_03
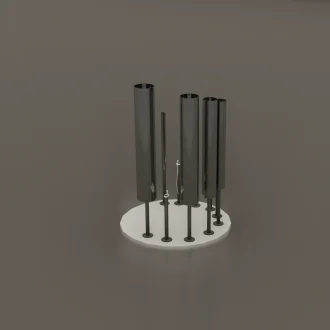
Pipe Bells
DM_03Visitors tap on 8 pipes, each with different diameters and thicknesses, creating a rhythm with the different sounds emanating from all of them.
DM_03 - AF_16
Richter Scale
AF_16On the table, there are buttons on the table that express 2023 Turkey -Syria Earthquake, 2020 Turkey Seferihisar Earthquake, 2010 Chile Earthquake, 2004 Indian Ocean Earthquake. In the device that works in the logic of the needle scale, the selected button is pressed. The needle on the desktop shows the magnitude of the earthquake, which is the energy equivalent of the event on this button.
AF_16 - AF_11
Rocks
AF_11There are rock types on the circle. When the inner circle is rotated, only the circle slice of the rock on the open surface is visible. On the circle slice, there are short information and visuals about the properties of this rock. At the same time, the students reach detailed information about the rocks by examining the rock samples in the plexi boxes.
AF_11